

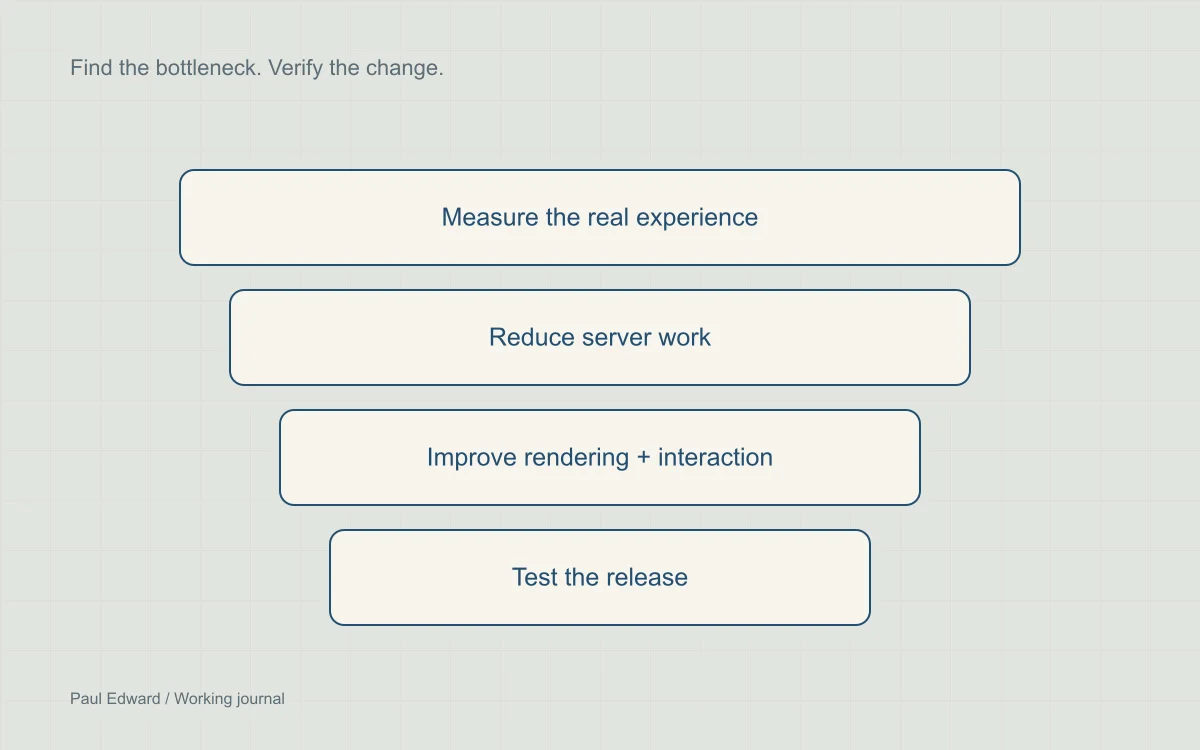
Start with the symptom, not a plugin
A page can respond quickly and still feel slow. Time to First Byte (TTFB) measures how long a navigation waits for the first response byte; Largest Contentful Paint (LCP) concerns the largest visible content; Interaction to Next Paint (INP) concerns responsiveness to clicks, taps and keyboard input. Improving one does not automatically fix the others.
This is a diagnostic guide, not a report of a measured client engagement. Use your own before-and-after evidence to decide whether a change worked.
Build a baseline you can compare
- Choose representative templates: an article, a category, a product and a checkout. Include both signed-in and anonymous sessions.
- Record device, network, location, URL, cache state and deployment version. Repeat lab runs under the same conditions instead of selecting the best score.
- Inspect field data in PageSpeed Insights or Search Console. A low-traffic URL may have no page-level data; origin data is broader and should be labelled accordingly.
- Separate cache hits from misses. A fast warm response can hide a slow origin during invalidation or a traffic spike.
Reduce server work safely
Inspect the document request in the browser network panel, then profile PHP, database queries and external API calls. Slow queries, repeated remote calls, worker saturation and a distant origin require different fixes. Persistent object caching can reduce repeated database work, but it is distinct from caching an entire HTML response.
Full-page caching can help anonymous editorial pages. Do not publicly cache account pages, carts, checkouts, authenticated responses or responses containing personal information. Review cookies, request methods, query parameters and cache keys with your host. Test with two independent sessions before deployment, and confirm content edits invalidate the relevant cache.
Improve what the browser paints
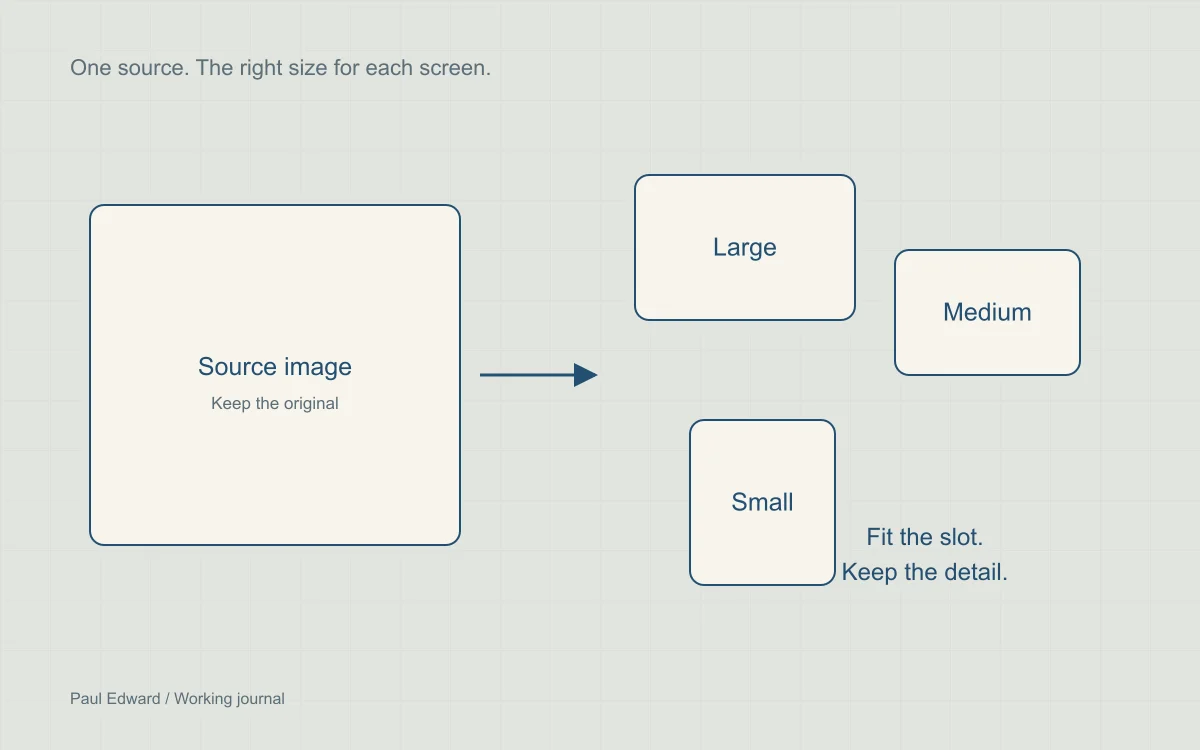
Identify the actual LCP element in a performance trace. If it is an image, expose its URL in the initial HTML, provide appropriately sized variants, and avoid lazy-loading it. If it is text, inspect render-blocking styles and font loading. Reserve space for media and embeds to reduce layout shifts.
For INP, reproduce the slow interaction and inspect the main thread. Reduce unnecessary work, split long tasks, and batch layout reads before writes. Moving work to a later task only helps if that later task does not become another large block.
// Yield between bounded chunks; feature-detect the scheduling API.
async function yieldToBrowser() {
  if (globalThis.scheduler?.yield) {
    await globalThis.scheduler.yield();
  } else {
    await new Promise(resolve => setTimeout(resolve, 0));
  }
}
// Process a small, measured batch, yield, then process the next batch.
Verify the experience after deployment
Good Core Web Vitals thresholds are LCP at or below 2.5 seconds, INP at or below 200 milliseconds, and CLS at or below 0.1, assessed at the 75th percentile of visits. TTFB helps diagnosis but is not itself a Core Web Vital. A Lighthouse load test does not measure real-session INP.
Retest checkout, navigation, consent tools and third-party widgets. Follow field measurements over time; the rolling collection window will not immediately reflect a release. Record the change and any regressions alongside your measurements.
Frequently asked questions
Will passing Core Web Vitals guarantee higher rankings?
No. A faster experience helps readers and can support search performance, but relevance, useful content and other signals still matter. Treat speed as a measurable product improvement, not a ranking promise.
Is TTFB one of the Core Web Vitals?
No. TTFB measures the delay before the first response byte and helps diagnose the server and network path. The Core Web Vitals are LCP, INP and CLS. Use TTFB to investigate a slow response, then separately check when useful content appears and how interactions behave.
Why is my cached homepage fast but checkout slow?
A public homepage may reuse cached HTML, while checkout needs fresh, session-specific work. Measure the uncached request and inspect database queries, extensions and external services. Do not make checkout publicly cacheable just to improve a benchmark; verify privacy and transaction correctness.
How should I compare performance before and after a change?
Keep the URL, device, network profile and cache state comparable, and repeat the test. Record the range of results and test the same customer action. Use field data as it becomes available; a single fast laboratory run does not describe every visitor. The performance checklist provides a broader verification sequence.
Sources and further reading
Keep exploring
Use the 47-point WordPress speed checklist to extend the audit, or explore website performance support.

Leave a Reply